-
Norm Wattenberger: When do various True Counts occur?
We all know that generally the higher the True Count the less often it will occur. I thought I?d take a look at the frequencies of True Counts by section of the deck in single deck play as this has some interesting effects on TC frequencies. The sims are AOII, SD, H17, quarter-deck deck estimation, flooring. I divided the deck into eights. The first round is ignored since the TC is always zero. I looked at TCs of 0 through +10. The TC frequencies are charted below:
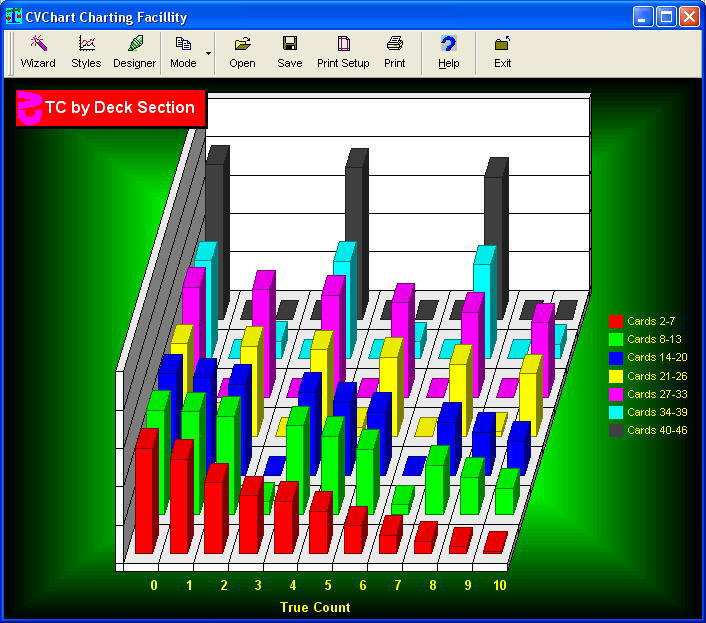
[*]The red bars are just as we would expect. The largest number of TCs are TC 0 and there are progressively fewer instances the higher the TC until there are very few TCs of +10.[*]The next eighth of the deck is represented by green bars. This looks much the same except that there are very few TCs of +3 and +7.[*]The blue bars show the next eighth of the deck. Here there are no TCs of +3 or +7.[*]When we get to the yellow bars, there are almost no TCs of +1, +5 and +9.[*]Deeper still, the pink bars show no odd TCs at all.[*]The cyan bars now show few TCs of +2, +6 and +10[*]And at the end, we have nothing but TCs of 0, +4 and +8.[*]Note that the TC +4 and +8 frequencies increase with depth.
 Posting Permissions
- You may not post new threads
- You may not post replies
- You may not post attachments
- You may not edit your posts
-
Forum Rules


Bookmarks