Blackjack Card Counting Volatility Cones
by , 04-25-2012 at 04:21 AM (3181 Views)
Well, the title isn’t accurate. But, it’s where I got the idea for a new, rather unusual, trio of charts.
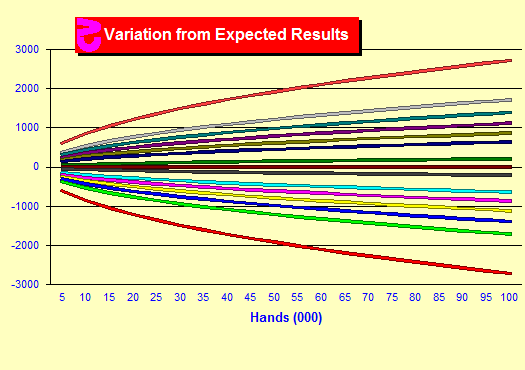
On page 443 of Modern Blackjack, I provide a chart of the theoretical range of results given a 90% confidence level. I thought that I would expand on this. These charts were based on playing six decks, S17, DAS, LS, 4.8/6 penetration, with a 1-15 spread using High-Low with full indexes and four players. Any set of circumstances provides a measurable advantage. Unfortunately, luck (i.e. variance) interferes and our results will rarely exactly match the theoretical advantage. In the below chart, we show our probable results given different levels of confidence. The x-axis is hands in thousands. The y-axis is the variation from expected results that might be expected for different confidence levels. For example, there is a line that goes right down the zero line. This is the 0% confidence level line. That is, there is essentially no chance that our results will exactly match the theoretical advantage. There are lines just above and below the center line. This is the range of variation that will occur 10% of the time. The red, outside lines show the possible range 90% of the time. That is, 90% of the time, the actual results will vary from expected results somewhere between the top and bottom lines. The lines are for 90%, 70%, 60%, 50%, 40%, 30%, 10%, and 0%.
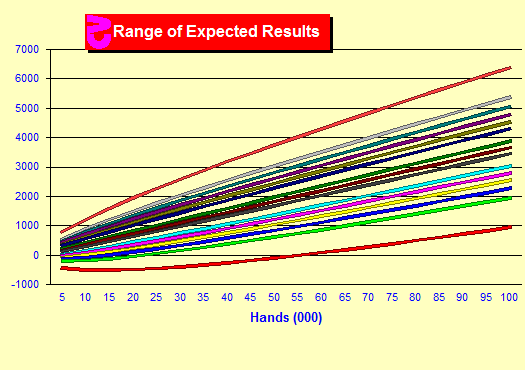
The second chart adds the expected results to the first chart. Since the first chart is the possible variation from expectation, when you add in expectation, the second chart provides the probable range of total results (units won or lost) for different confidence levels. So, the results will fall somewhere between the top and bottom lines, 90% of the time. 70% of the time, results will fall somewhere between the next-to-top and next-to-bottom lines, etc. The possible range increases as the number of hands increases, but the trend is upward, such that after a number of hands results are far more likely to be positive.
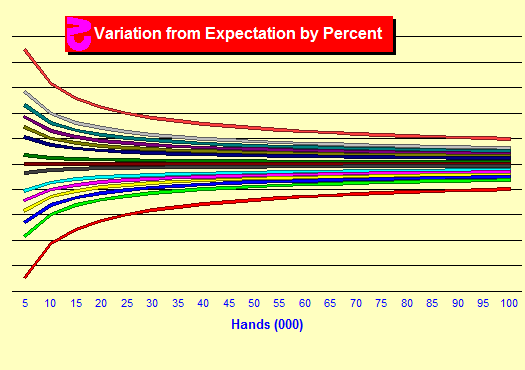
But wait. We were told that the longer you play, the closer to expectation you should be. This appears to suggest the longer we play, the farther from expectation. That is because these charts are in units, not in percentage of the total amounts bet. If we take the first chart, and convert it from units won to advantage (percent of amount bet that was won), we then see (below) that the longer we play, the closer we should be to the expected advantage in percent. And this is important. Yes, the more hands we play (assuming we are playing correctly), the closer we will find ourselves to expected advantage. But, the wider the possible range in units won or lost.


